

[Note on Brand Evolution] This post discusses concepts and methodologies initially developed under the scientific rigor of Shaolin Data Science. All services and executive engagements are now delivered exclusively by Shaolin Data Services, ensuring strategic clarity and commercial application.
About the Data
The dataset is acquired from ExcelBIAnalytics.
HR Analytics Dataset with 200,0000 records for attrition analysis.
- There are 2 million rows and 35 columns.
- Thus 2 million records or entries.
Disclaimer from Website:
Disclaimer – The datasets are generated through random logic in VBA. These are not real HR data and should not be used for any other purpose other than testing.
About the Toolkit
This project uses Python version 3.x and to perform big data analytics. It uses the following libraries:
- pandas for reading a CSV file into a DataFrame
- scipy for probabilistic analytics
- numpy for deterministic analytics
- seaborn for plotting a pairwise relationship in a dataset
- Scikit-learn for machine learning and computing a confusion matrix
- matplotlib and plotly for creating visualizations.
Copyright 2023 Jevon Morris.
A Case Study of Employee Attrition
Scope
This document is intended for senior management authorized personnel who are entrusted with human resources, decision-making over employee retention, talent acquisition, and staff placement. Developers, designers, and data governance staff members, who are interested in implementing a machine learning model should consider this document. The data and features of interest to this study are:
- Age,
- Daily Rate,
- Distance From Home,
- Education,
- Employee Count,
- Environment Satisfaction,
- Hourly Rate,
- Job Involvement,
- Job Level,
- Job Satisfaction,
- Monthly Income,
- Monthly Rate,
- Number Of Companies Worked For Previously,
- Percent Salary Hike,
- Performance Rating,
- Relationship Satisfaction,
- Standard Hours,
- Stock Options Level,
- Total Working Years,
- Training Times Last Year,
- Work-Life Balance,
- Years At Current Company,
- Years In Current Role,
- Years Since Last Promotion,
- Years With Current Manager
- Attrition,
- Business Travel,
- Department,
- Education Field,
- Gender,
- Job Role,
- Marital Status,
- Over 18,
- Overtime
The desired outcome from this investigation is to not only find a correlation between factors that may influence a staff member to continue their career at a different organization but to extrapolate from the positive retention factors and encourage the introduction of new talent.
Purpose
This type of analysis aims to return such information as the correlation between employee attrition and various factors. The company then uses the negative correlations, inverse relationships, to decrease attrition and promote employee retention. Then, the company decreases the effects of the positive correlations to discourage employee attrition.
Supporting Forces
The standard statistical analysis procedures were able to reveal sufficient results. Analyzing the correlation coefficients between variables produced the heatmap in Figure 1. Moreover, the other aspects of data analysis, such as Pandas and Plotly, were functional.
Figure 1.
Heatmap.
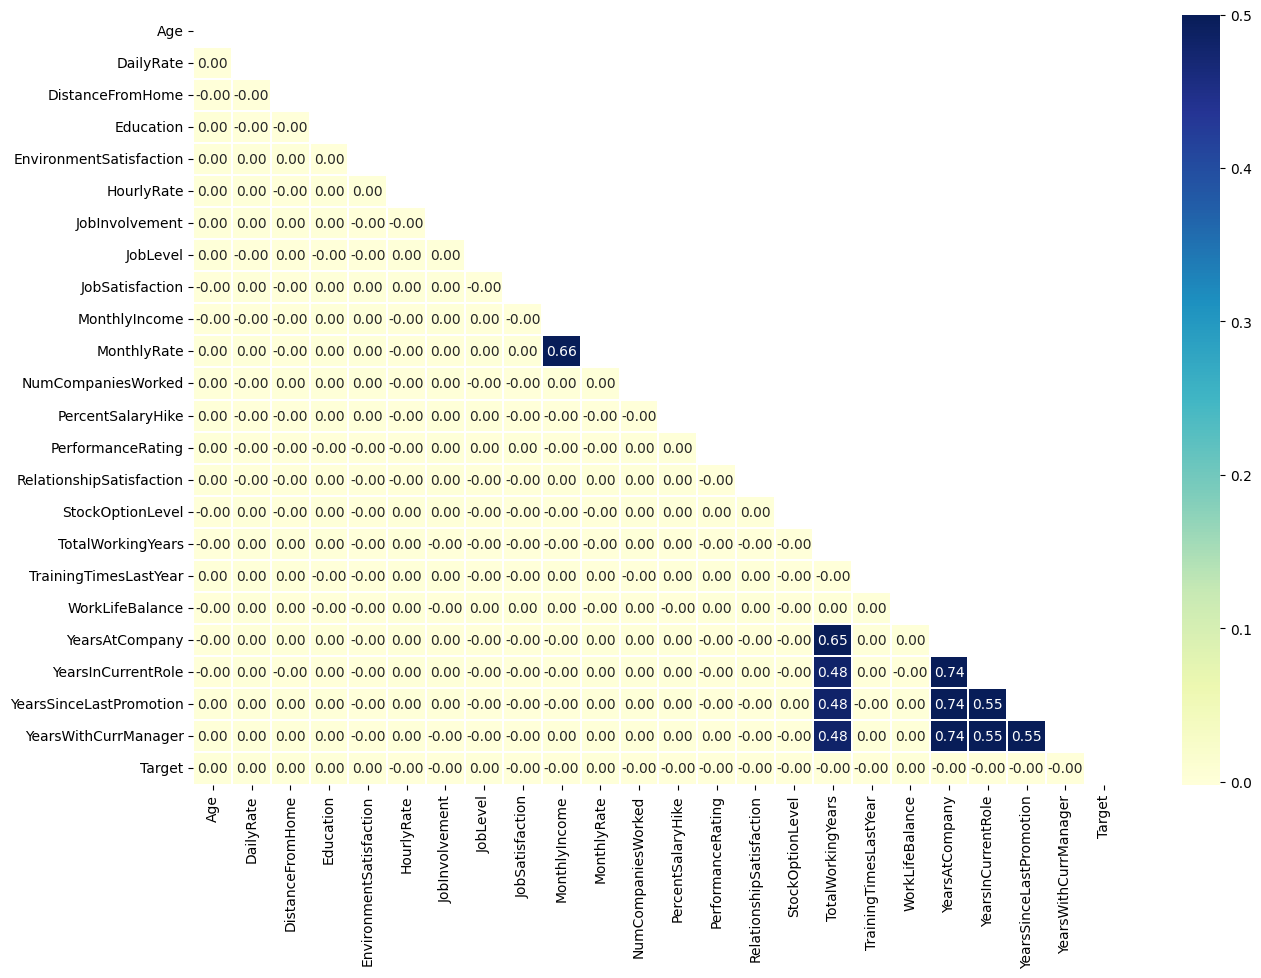
Then, further coefficient analysis revealed the top ten positive and negative correlations and their coefficients as detailed in Table 1.
Table 1.
Features and correlation coefficients.
| Most Positive Correlations | |
| Feature | Coefficient |
| Job Involvement | -0.00005 |
| Work Life Balance | 0.000134 |
| Age | 0.000205 |
| Monthly Rate | 0.00024 |
| Education | 0.000354 |
| Distance From Home | 0.00042 |
| Daily Rate | 0.000959 |
| Job Level | 0.001203 |
| Environment Satisfaction | 0.001617 |
| Most Negative Correlations | |
| Feature | Coefficient |
| Years In Current Role | -0.00145 |
| Years At Company | -0.001229 |
| Num Companies Worked | -0.001151 |
| Percent Salary Hike | -0.000966 |
| Hourly Rate | -0.000953 |
| Years With Curr Manager | -0.000889 |
| Years Since Last Promotion | -0.00083 |
| Stock Option Level | -0.000748 |
| Monthly Income | -0.000627 |
| Relationship Satisfaction | -0.000502 |
Challenging Forces
The resources in the given runtime environment were insufficient for artificial intelligence, machine learning, or deep learning models.
Methods
This analysis used Python version 3. It also uses the following libraries for their detailed purposes.
- pandas for reading a CSV file into a DataFrame
- scipy for probabilistic analytics
- numpy for deterministic analytics
- seaborn for plotting a pairwise relationship in a dataset
- Scikit-learn for machine learning and computing a confusion matrix
- matplotlib and plotly for creating visualizations.
Models
Since logistic regression provides the odds of an event occurrence, it is highly popular in terms of being applied to modeling a binary response. Then, it is also particularly applicable in answering whether the employee is active or inactive. Since logistic regression improves traditional linear regression, the best fit for this visual is a general linear model (GLM). Then, choosing the proper features to train the model can be daunting. However, Random Forest is particularly adept at displaying the importance of each feature in the dataset, thereby reducing the necessary dimensions for analysis. The random forests classifier in Sci-kit Learn outputs a bar chart. The taller the bar, the more important the feature.
Evaluation
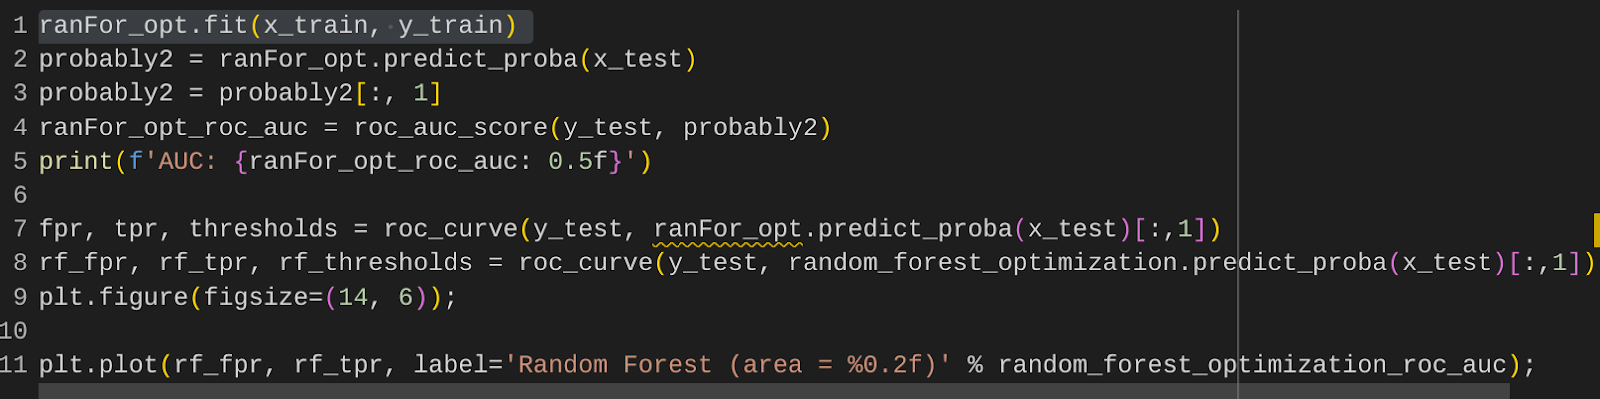
To measure the performance of each of these models, to make the best selection going forward, the metrics of the area under the curve (AUC) receiver operating characteristic (ROC), as well as the accuracy of each model. Briefly, the ROC-AUC describes the ability of the model to differentiate between classes; the higher the AUC, the better the model is at this distinction. Therefore, using Python and sklearn, Figure 2 displays an example of model performance code for the random forest.
Figure 2
Random Forest ROC AUC
Results
According to the map, employees do not appear to mind staying at a given company for a long period of time. However, they do mind if they are in the same role for a long period of time. They also mind if they are with the same manager for a long period of time. Then, they also mind if they grow stagnant or have not received a promotion in a long period of time. According to the heatmap, these factors play a significant role in mitigating employee attrition.
Conclusion
Machine learning has many advantages in its use cases and degrees of application. When considering the question of “what makes an employee dissatisfied with their organization” or “why would an employee leave a company?” the application of machine learning is apt to provide the path to the answer. Given the uniqueness of each employee and the magnitude of the dataset involved, the proper features, visualization techniques, data acquisition methodology, and even the architecture must be carefully considered.

Leave a comment